August 10, 2024
Struggling to forecast demand, sales, or KPIs to make smarter business moves? Check this out:
We built a time series solution using LSTM modeling to predict e-scooter demand in
Chicago - pinpointing exactly where and when to deploy scooters for maximum impact. The result?
Targeted insights
delivered through an interactive R Shiny dashboard, a projected 4% quarterly revenue boost, and
a roadmap
for any operator looking to optimize resources, cut costs, and drive growth. If you want data
that
powers real decisions, this is your playbook.

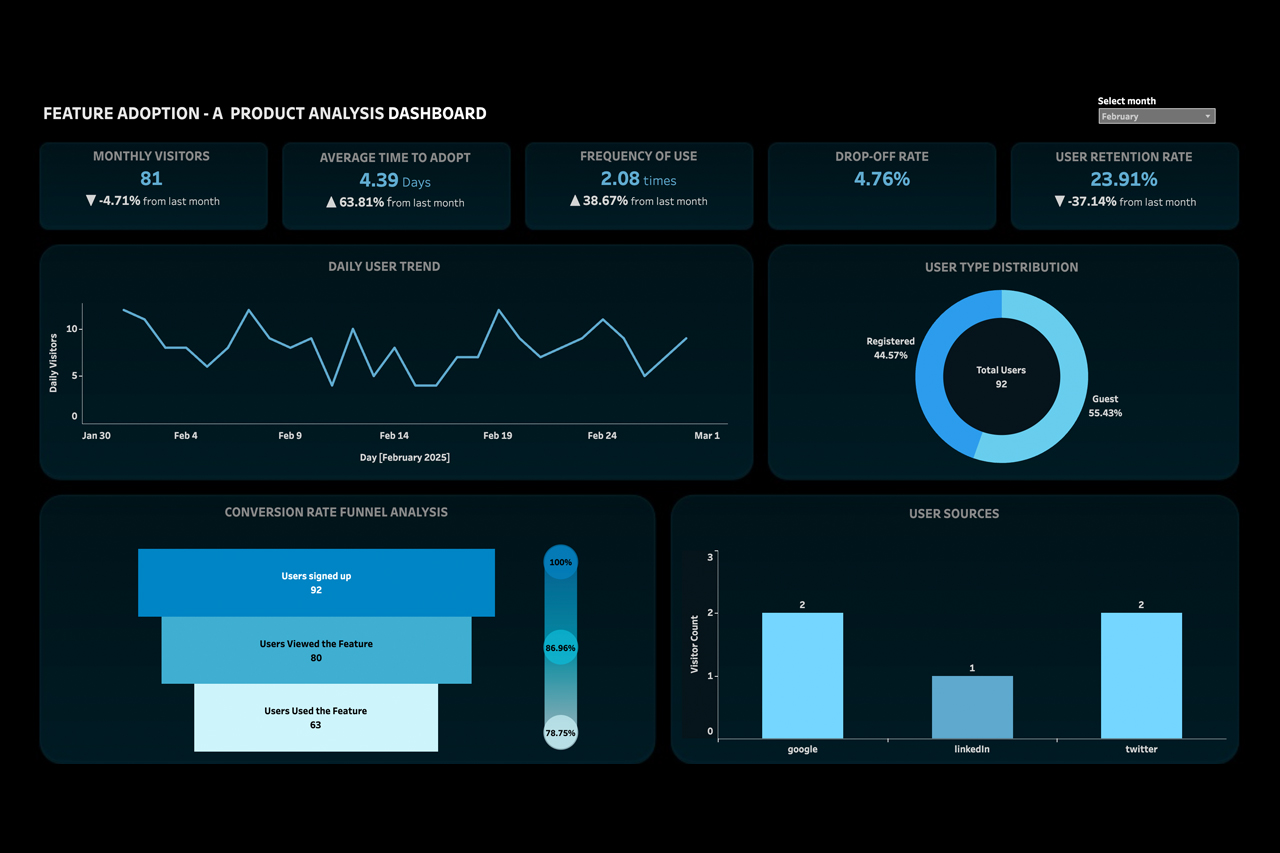
Curious how users really interact with your latest product feature?
This interactive Tableau dashboard gives you instant clarity on key KPIs-like Active Users,
Drop-off Rate, and User Retention-so you can track engagement and spot trends fast. Behind the
scenes,
robust data pipelines pull event data from tools like Amplitude and Heap, with Google BigQuery
and DBT powering seamless transformations. Dive in and see how your feature performance can be
measured!

Ever wish AI could name your products or create image captions for greater accessibility?
Check out this generative AI project: using TensorFlow and the VGG16 model, it automatically
generates captions for images -
perfect for e-commerce, accessibility, or media tagging. Even as a proof of concept, it’s
already hitting a BLEU score
of 0.54 and shows huge potential for automating product descriptions and making digital content
more inclusive.
Have a look!

Unlock higher booking success - the KPI that drives airline profitability. This project dives
deep
into what truly influences
customer booking completion, analyzing booking attributes and their impact on conversion rates.
Discover actionable insights
airlines can use to boost customer engagement, sharpen marketing strategies, and streamline
operations for maximum booking
success, through an interactive tableau dashboard.

Curious how messy, real-world data can drive powerful insights? This project connects New York
City housing and school crime data,
modeling complex, multi-variate sources into facts and dimensions for seamless analysis. Using
SQL, it uncovers the
relationship between affordable housing and school crime - delivering actionable insights to
support equitable housing
policies and help urban planners build safer, more inclusive communities.

See how messy, real-world data transforms into actionable insights with this interactive Tableau
dashboard connecting NYC housing and school crime data. By analyzing affordable housing trends
from 2014 to 2023,
this project empowers residents to make informed decisions and equips policymakers with the
insights
needed to craft smarter, data-driven housing policies. It’s a must-see resource for anyone
shaping safer,
more equitable urban communities.

Looking to forecast key business metrics like sales or consumption with ease? This project
harnesses the power of the
Prophet model, enhanced with hyperparameter tuning, to deliver highly accurate electricity
consumption forecasts
across the US. With these insights, energy providers can optimize distribution, plan more
efficiently,
and make smarter, data-driven decisions for a sustainable future - all through a simple,
scalable forecasting solution.

Want to boost sales and customer loyalty with targeted campaigns and recommendations? This
project uses K-means
clustering in Python to segment Starbucks customers by their behaviors and preferences,
unlocking the power to
deliver personalized marketing strategies. With these actionable insights, you can enhance
engagement,
improve retention, and drive meaningful sales growth. Have a look!

Struggling with customer churn? This project shows how to proactively identify customers at risk
of leaving and offers
actionable strategies to reduce churn rates. Using logistic regression, advanced hyperparameter
tuning, and SMOTE
to handle data imbalance, it accurately predicts churn for a telecom company - providing a
practical blueprint for
churn prediction and retention strategies across any business.